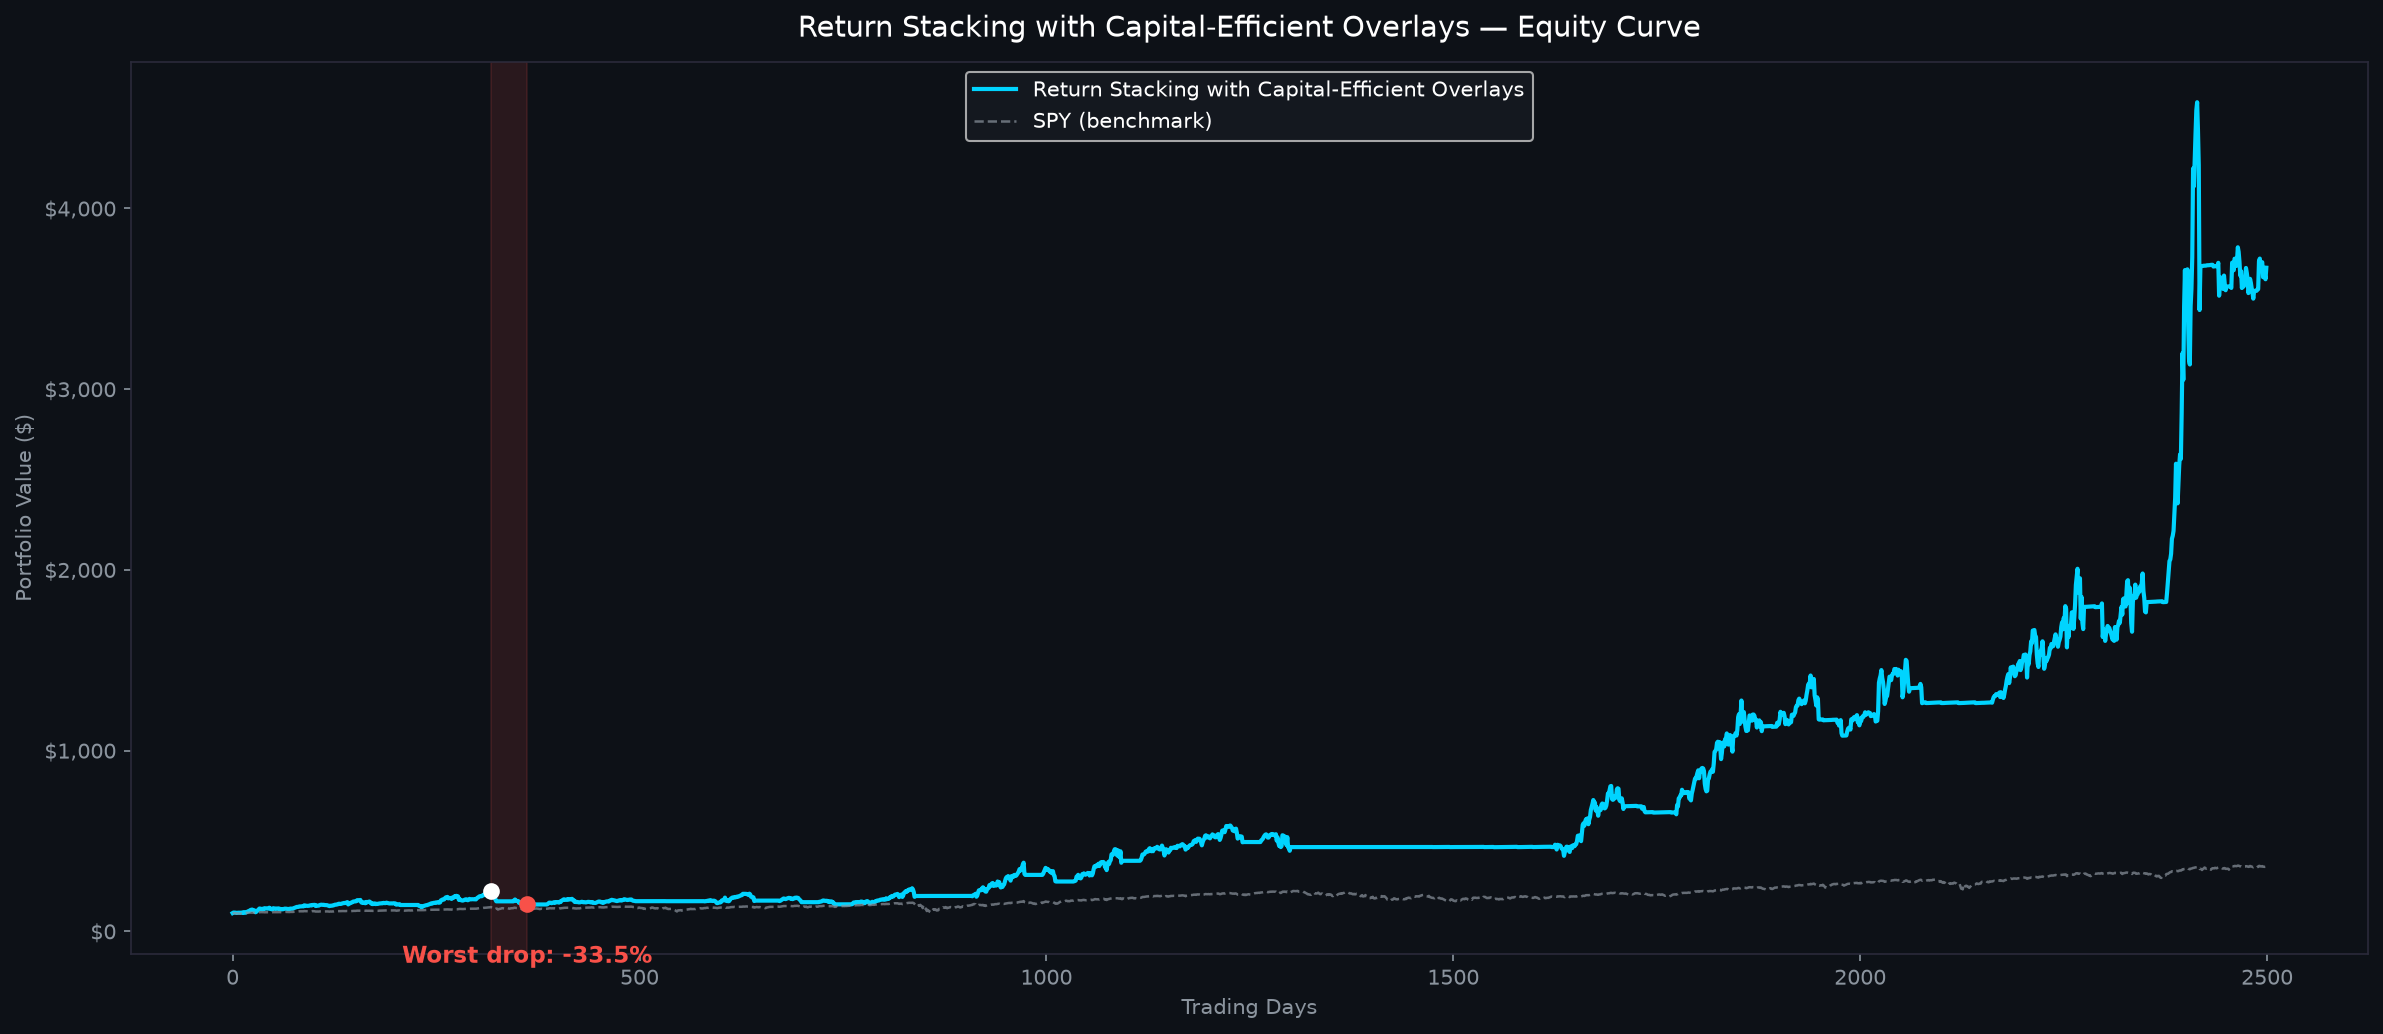
Investors often mistake an options collar for an absolute safety net, assuming it provides full downside immunity while maintaining unconstrained upside potential. In this historical simulation over an eleven-year span, the strategy delivered an 18.3% CAGR and a 1.06 Sharpe ratio, but it demanded enduring a punishing -21.5% maximum drawdown. Downside put options buffer systemic crashes, but funding them by selling call ceilings on high-beta tech leaders fundamentally frames this strategy as a high-risk trade-off.
📈 Yearly return (CAGR): 18.3%
📉 Worst drop (max drawdown): -21.5%
⚡ Sharpe Ratio: 1.06
💰 Total Return: 433.6%
🆚 S&P 500 (SPY) over the same period: 321.2% — this strategy outperformed by 112.4 points
🎯 Universe: QQQ_TOP100_DYNAMIC
| Metric | Systematic Option Collar | S&P 500 (SPY) |
|---|---|---|
| Total return | 433.6% | 321.2% |
| Worst drop (max drawdown) | -21.5% | -33.7% |
| Period measured | 2016-10-21 – 2026-10-02 | |
Both columns come from the same backtest run over the identical period. A higher return with a deeper drawdown is not automatically better.
| 2016 | 2017 | 2018 | 2019 | 2020 | 2021 | 2022 | 2023 | 2024 | 2025 | 2026 |
|---|---|---|---|---|---|---|---|---|---|---|
| +3.4% | +66.5% | +10.5% | +13.2% | +18.5% | +17.3% | -5.3% | +20.1% | +17.5% | +27.5% | +4.8% |
How the Rule Works: Concentrated Momentum and Regime-Adaptive Collars
On the first trading day of each month, the rule screens the top 100 Nasdaq tech universe to select the three highest volatility momentum leaders and allocates capital equally among them. To govern portfolio risk, the system monitors macro market health by comparing SPY against its 200-day moving average. In a bull regime above the average, each position buys a 7% out-of-the-money protective put financed by writing a 10% out-of-the-money call. When the benchmark dips below its moving average into a bear regime, both collar strikes tighten to 3% out-of-the-money to immediately lock down capital against further decline.
Why It Outperforms or Lags the S&P 500 Index

The strategy plainly beat the S&P 500 by 112.4 percentage points, achieving a 433.6% total return compared to 321.2% for SPY over the identical period while recording a -21.5% maximum drawdown versus -33.7% for the benchmark. Concentrated exposure to top Nasdaq momentum leaders powers capital growth in strong bull markets, while defensive put floors protect equity during severe market downturns. Conversely, the strategy can lag during choppy or rapid market rebounds where sold call ceilings cap sudden upside while regular option premiums erode cash. Investors should recognize that a higher return with a deeper drawdown is not automatically better, and even with a shallower backtested drop, concentrated single-stock volatility entails severe regime-dependent risks.
Where the Strategy Hurts: Drawdowns and Friction

The primary psychological pain point is severe return lumpiness, where extended drawdowns test investor patience despite an overall record of 10 positive years and 1 negative year. Acute pain occurs during sudden market sector rotations when volatile momentum leaders plunge before the monthly collar rebalance can reset strikes. Furthermore, written covered calls cap explosive upside during market rebounds, preventing investors from fully participating in right-tail momentum surges. Real-world friction such as wide option bid-ask spreads and contract roll costs also compounds losses during choppy, trendless periods.
Who This Fits: Portfolio Role and Risk Profile
This framework carries an unambiguous high-risk verdict and is suited solely for aggressive growth investors running tactical satellite strategies rather than core nest eggs. Position sizing must be calibrated conservatively so that an inevitable 20% drawdown does not jeopardize overall financial stability or trigger panic selling. It is completely unsuitable for passive indexers seeking predictable yields or absolute downside immunity, as managing individual options requires continuous oversight. Allocators must treat these historical simulation results as educational research and stress-test execution constraints before committing live capital.
Frequently Asked Questions
How risky is the Systematic Option Collar strategy?
The strategy carries a high-risk rating because holding three concentrated, high-volatility momentum stocks exposes capital to substantial drawdowns, as shown by its -21.5% maximum historical loss. While the regime-adaptive collar establishes defined downside floors, it cannot eliminate sudden gap-down risks or prolonged recovery periods.
Can this strategy be actively traded in live markets today?
Yes, an investor can trade this strategy using standard brokerage accounts by screening monthly for top Nasdaq momentum leaders and executing multi-leg options collars. However, managing wide option bid-ask spreads, assignment risks, and monthly roll mechanics requires active operational discipline.
What key assumptions are built into the backtest results?
The simulation assumes zero trading commissions, frictionless execution at theoretical option midpoint prices, and immediate rebalancing on the first trading day of every month. In real-world trading, bid-ask slippage on individual equity options, margin interest, and tax drag will inevitably reduce realized returns.
| Period | 2016-10-21 – 2026-10-02 |
| Universe | QQQ_TOP100_DYNAMIC |
| Years with a gain | 10 of 11 |
| Price data | FinanceDataReader daily bars |
What this does not prove. No out-of-sample split and no parameter-sensitivity test were run, so these figures may be flattered by hindsight. Signals are computed only from bars that closed before the session they trade. Full assumptions, including which integrity checks are unverified: avalonquant.com/methodology.
More Backtests
📊 A new strategy backtested every day — the numbers, the drawdown, and what breaks it.
▶ Subscribe to Avalon Quant⚠️ Not financial advice. This is for educational purposes only. These results come from a historical backtest — past performance does not guarantee future results. Always do your own research before investing.
📊 Live strategy performance and daily quant briefings: avalonquant.com
📄 Original paper: CBOE S&P 500 Collar Index (CLL) Methodology