In an 11-year historical simulation, a hypothetical $10,000 stake compounded at a 43.7% annualized rate (Sharpe 1.18) into more than $367,500, vastly outpacing the broad market benchmark. However, capturing those exponential gains required enduring a punishing 33.5% maximum drawdown, placing this systematic return-stacking framework squarely into the high-risk category. This briefing breaks down the underlying mechanical rules, regime-dependent trade-offs, and critical psychological hurdles necessary to evaluate whether this model is viable in live conditions.
📈 Yearly return (CAGR): 43.7%
📉 Worst drop (max drawdown): -33.5%
⚡ Sharpe Ratio: 1.18
💰 Total Return: 3575.5%
🆚 S&P 500 (SPY) over the same period: 259.4% — this strategy outperformed by 3316.1 points
🎯 Universe: TQQQ, UPRO, SOXL, FNGU, BULZ, TECL, TNA, SPXL, TLT, IEF, GLD, SHY, BIL
| Metric | Return Stacking with Capital-Efficient Overlays | S&P 500 (SPY) |
|---|---|---|
| Total return | 3575.5% | 259.4% |
| Worst drop (max drawdown) | -33.5% | -34.1% |
| Period measured | 2016-10-21 – 2026-10-02 | |
Both columns come from the same backtest run over the identical period. A higher return with a deeper drawdown is not automatically better.
| 2016 | 2017 | 2018 | 2019 | 2020 | 2021 | 2022 | 2023 | 2024 | 2025 | 2026 |
|---|---|---|---|---|---|---|---|---|---|---|
| +21.3% | +45.3% | -5.5% | +5.6% | +83.3% | +44.5% | +0.0% | +90.3% | +49.5% | +21.8% | +127.6% |
How the Rule Works: Dual-Speed Trend and Volatility Overlay
On the final trading day of each month, the model evaluates the broad market by checking whether the S&P 500 trades above its 200-day simple moving average baseline. When the benchmark sits above this threshold, capital is deployed into top-performing amplified growth assets—spanning tech and broad equity indexes—stacked alongside stabilizing allocations to long-term treasuries and gold. If the benchmark drops below its 200-day line, the strategy immediately sheds all amplified risk assets and rotates entirely into ultra-short treasuries or cash equivalents. To prevent whipsaw losses between monthly rebalance dates, the adapted framework incorporates a 20-day volatility overlay that preemptively trims exposure whenever short-term market variance spikes.
Outperforming the S&P 500: Leverage Gains Versus Regime Risks
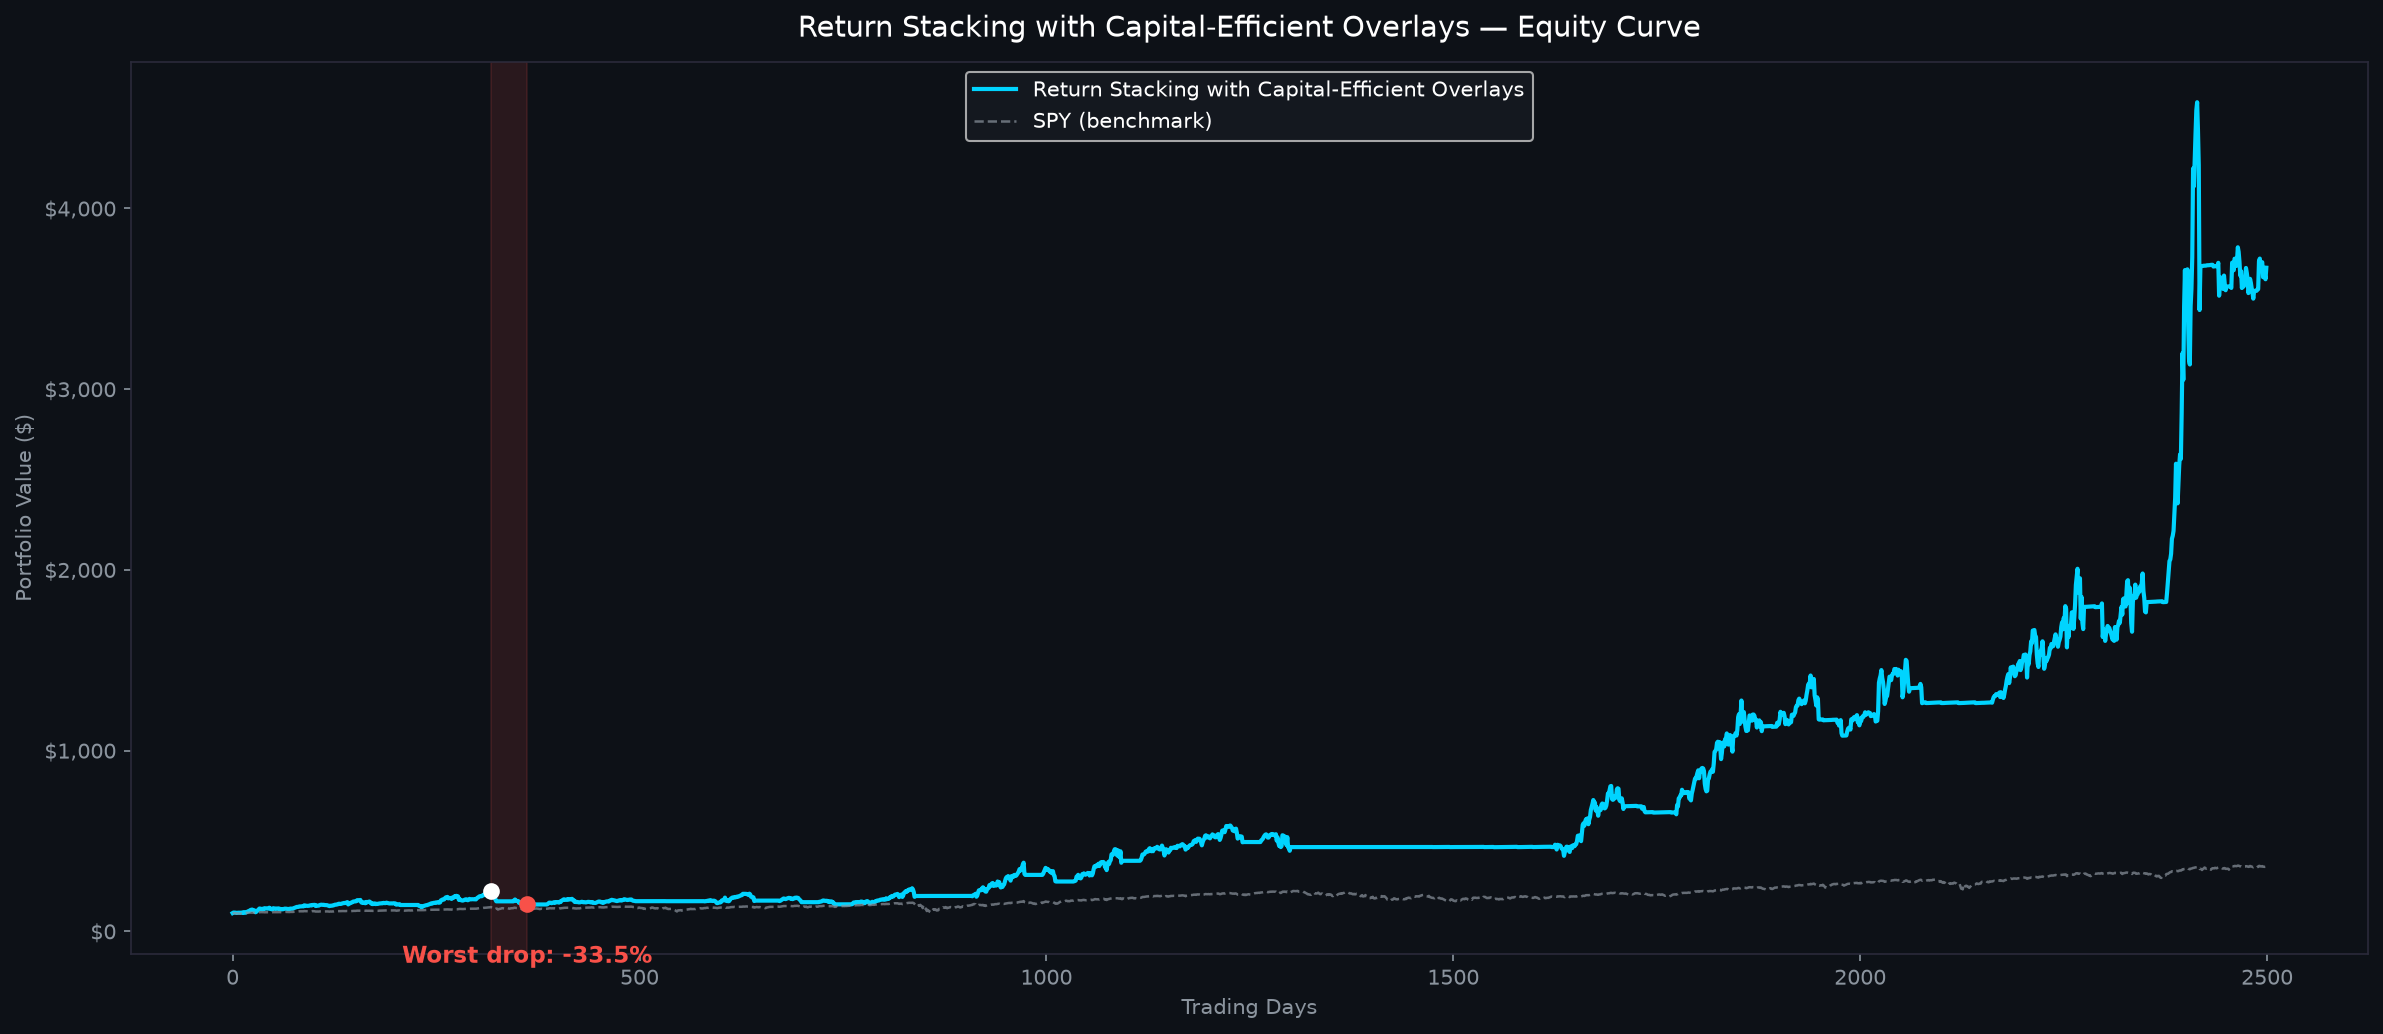
The strategy decisively beat the S&P 500 over the simulation period, outpacing the benchmark’s 259.4% total return by 3,316.1 percentage points while experiencing a comparable maximum drawdown (-33.5% versus -34.1%). It generates massive outperformance during sustained bull markets by stacking amplified growth exposures with defensive overlays, compounding upside when broader equity trends remain intact. However, the strategy can severely lag or lose capital during sideways, volatile regimes where daily leverage decay eats away gains and frequent trend whipsaws force costly rebalancing. A higher simulated return does not automatically make the model superior, as the amplified exposures introduce extreme volatility and structural tail risks that standard index holders never have to confront.
Where the Strategy Hurts: Drawdown Pain and Leverage Decay
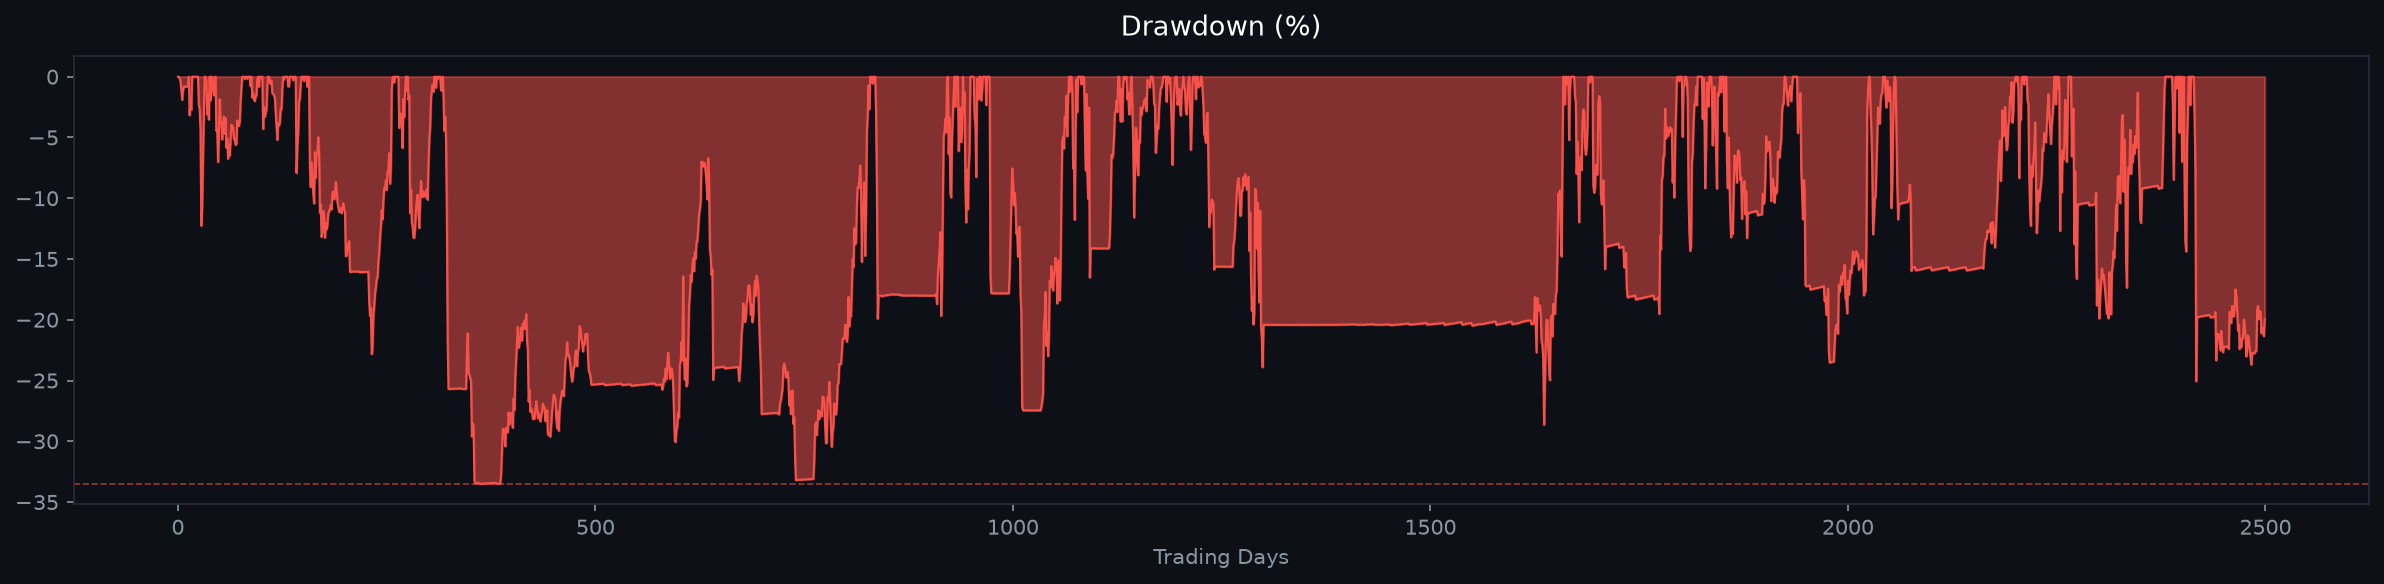
The most agonizing phase of this strategy occurs during rapid, unannounced market reversals that strike between monthly evaluation dates before defensive shifts can execute. Because the core growth basket uses high-beta amplified products, sharp declines compound downward with punishing speed, wiping out quarters of progress within days. Choppy, range-bound environments inflict further damage through constant volatility drag, where daily compounding resets steadily erode capital even without a sustained downtrend. Surviving these punishing stretches requires total psychological detachment, as investors who abandon the model during an extended drawdown lock in devastating permanent losses.
Who It Fits: Aggressive Mandates with High Risk Tolerance
This model fits only aggressive, experienced investors who possess the emotional fortitude and capital buffer required to endure steep peak-to-trough declines. It belongs strictly as a satellite growth sleeve rather than a core retirement portfolio, sized conservatively so that severe downturns cannot jeopardize long-term solvency. Investors seeking predictable income, low volatility, or hands-off buy-and-hold investing should avoid it entirely due to its structural exposure to leveraged decay and active rotation. Because backtested simulations cannot capture future liquidity shocks or structural regime shifts, allocators must treat these findings as experimental research rather than guaranteed performance.
Frequently Asked Questions
How risky is this return stacking strategy compared to traditional portfolios?
The strategy is classified as high risk because its leveraged equity overlays can generate sudden drawdowns exceeding 30%, far surpassing the volatility of conventional balanced portfolios. It requires strict position sizing and deep risk tolerance to withstand sharp downside swings.
Can this strategy be implemented and traded today?
Yes, investors can execute the strategy today using readily accessible, liquid exchange-traded funds including leveraged equity ETFs, treasury funds, and physical gold. However, live trading requires diligent monthly execution, strict monitoring of short-term volatility, and careful attention to transaction costs and tax drag.
What key assumptions are built into the backtest simulation?
The historical simulation assumes frictionless monthly rebalancing at official closing prices without accounting for brokerage commissions, slippage, borrowing fees, or tax consequences. It also assumes continuous liquidity across all leveraged ETFs and presumes that historical volatility and trend dynamics will persist in future markets.
| Period | 2016-10-21 – 2026-10-02 |
| Universe | TQQQ, UPRO, SOXL, FNGU, BULZ, TECL, TNA, SPXL, TLT, IEF, GLD, SHY, BIL |
| Years with a gain | 10 of 11 |
| Price data | FinanceDataReader daily bars |
What this does not prove. No out-of-sample split and no parameter-sensitivity test were run, so these figures may be flattered by hindsight. Signals are computed only from bars that closed before the session they trade. Full assumptions, including which integrity checks are unverified: avalonquant.com/methodology.
More Backtests
📊 A new strategy backtested every day — the numbers, the drawdown, and what breaks it.
▶ Subscribe to Avalon Quant⚠️ Not financial advice. This is for educational purposes only. These results come from a historical backtest — past performance does not guarantee future results. Always do your own research before investing.
📊 Live strategy performance and daily quant briefings: avalonquant.com
📄 Original paper: Return Stacking: Strategies for Overcoming a Low Return Environment
Go further on AvalonQuant
- Return Stacking with Capital-Efficient Overlays: re-run backtest — equity curve, max drawdown -33.5%, CAGR 43.7% (2016–2026), and how it ranks by drawdown.
- Research pack — a crypto perpetual strategy with the backtest source that reproduces every number on its page.
- Free Strategy Kit — runs strategies on your own exchange account, Paper mode by default.
Backtests are hypothetical and do not guarantee future results. Not investment advice.

